LI-YUXUAN-TSWD-Portfolio
Catalog of Final Project
Part I: Brief Intro & Overview: Working Overtime in the U.S.
Part II: storyboards and user research
Part III: Final project and presentation
Shorthand Website Link: Shorthand for final presentation
Outline
Project Summary 📖
This project looks at the working overtime situation in the U.S..
According to The ILO Department of Statistics, the average working hours in the United States are relatively short compared to countries like China and India. However, is it true that there is no overtime culture in the United States? Apparently, not so. Various social surveys and news reports show that employees in the U.S. suffer from significant overtime and are afraid to take vacations.
To change this dilemma, to find the root cause, and to help the CMU students who will soon graduate and enter the workforce learn to refuse to work overtime, we need each of us to concern and analyze working overtime.
Topic 🎯
How to solve the dilemma of working overtime in the U.S.
✨Feedback from Classmates:
| Can add the CMU students to tittle, like CMU students how to refuse work overtime, to attract our classmates! |
Reader Perspective 👨👨👧👦
As an employee or a prospective employee, I want to see the current overtime situation in the United States, the root causes of overtime and how to avoid it, so that I can try to avoid working overtime in the future to achieve work-life balance.
Call To Action 💪
I can do this by refusing to work overtime meaningless because of anxiety, learning to balance life and work by keeping in mind the psychological and physical health hazards of overtime work. When overtime is so serious that it has infringed on my right, I will stand up to refuse and defend my right.
The Story Arc 💕

Project Structure
The whole story is divided into 7 big scenarios of smaller story points:
Scenario 1: Introduce the working hours in the countries of the world and compare with each other.
Scenario 2: Focus on the average working hours in the United States.
Scenario 3: Pay attention to the US paid time off situation and holiday usage data.
Scenario 4: Concern about the hazards of overtime work.
Scenario 5: Explore why employees work overtime even though there are so many hazards.
Scenario 6: Study what kind of people are more courageous to refuse to work overtime.
Scenario 7: Call to reject meaningless working overtime.
✨Feedback from Classmates:
| Combine some scenario and give small stories in each scenario. The logic can be "Introduction-Fact-Cause-Solution". |
Scenario 1️⃣ WoW! It seems that in the U.S. overtime is not serious
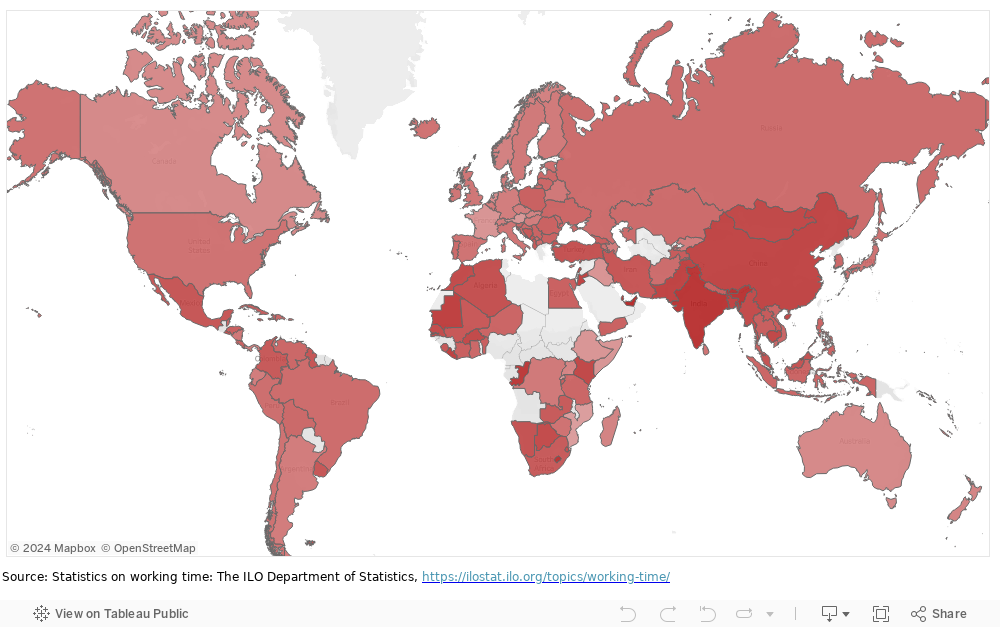
Introduce the working hours in the countries of the world and compare with each other.
The data of average hours per week per employed person is useful to the level of working overtime in the countries of the world1.
“ From the graph we can find that China and India are the ones with the highest working hours, and the situation in the US does not seem to be as bad.”
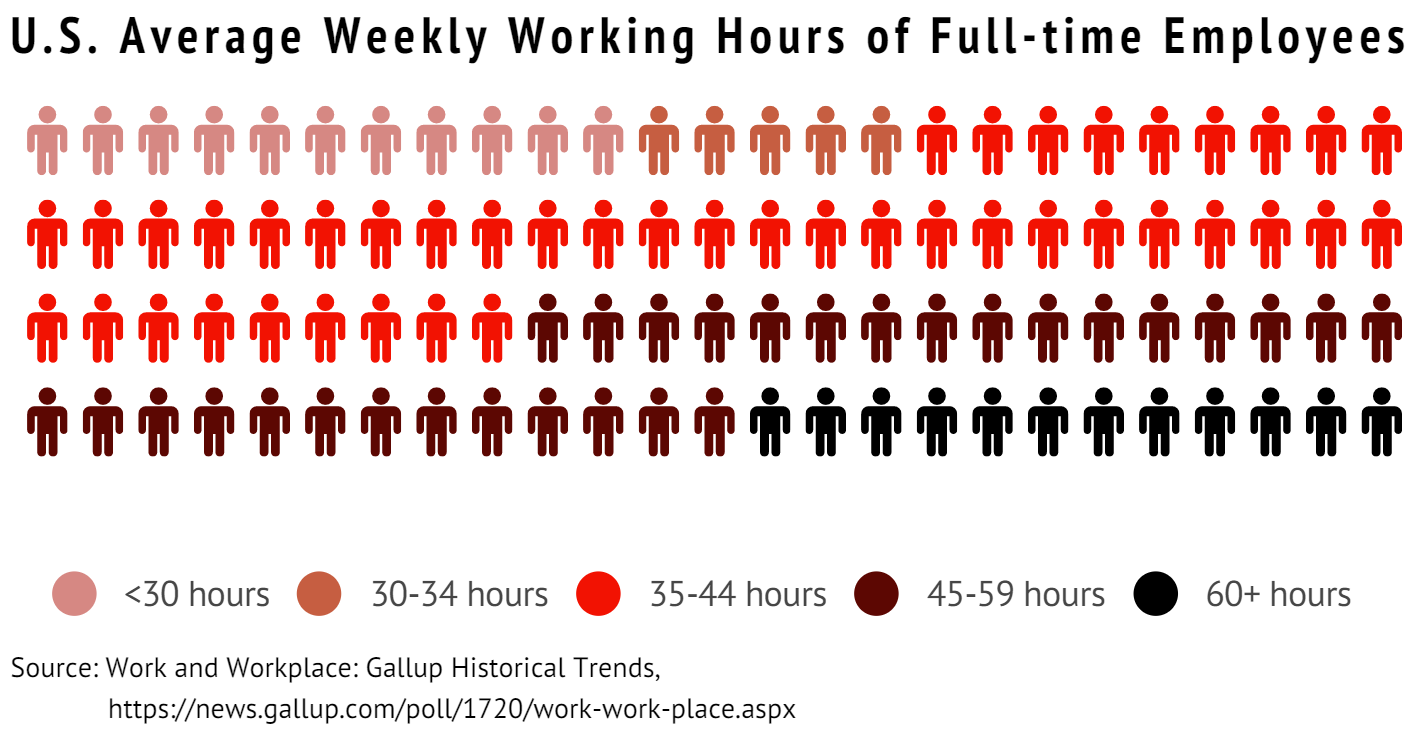
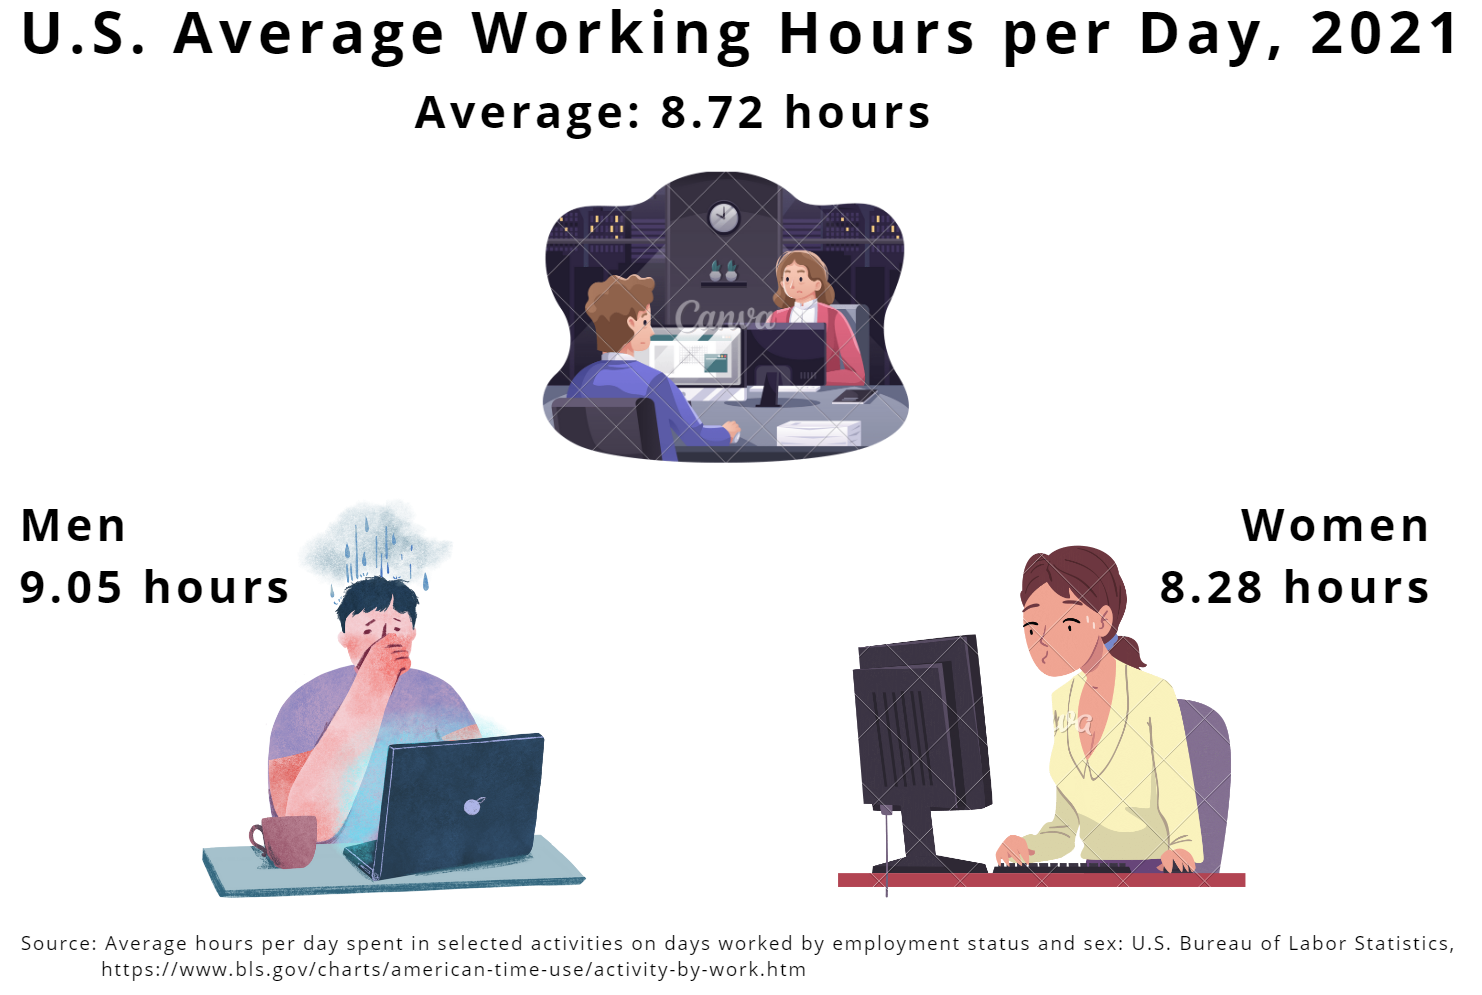
Scenario 2️⃣ But the U.S. employees are also working overtime…
In this scenario, we will focus on the average working hours in the United States.
The survey2 from Gallup Company and report from U.S. Bureau of Labor Statistics3 will give us more inspiration.
✨Feedback from Classmates:
| Can add the CMU students to tittle, like CMU students how to refuse work overtime, to attract our classmates! |
The difference between different reds is not obvious, you can use green-gray-red to distinguish.
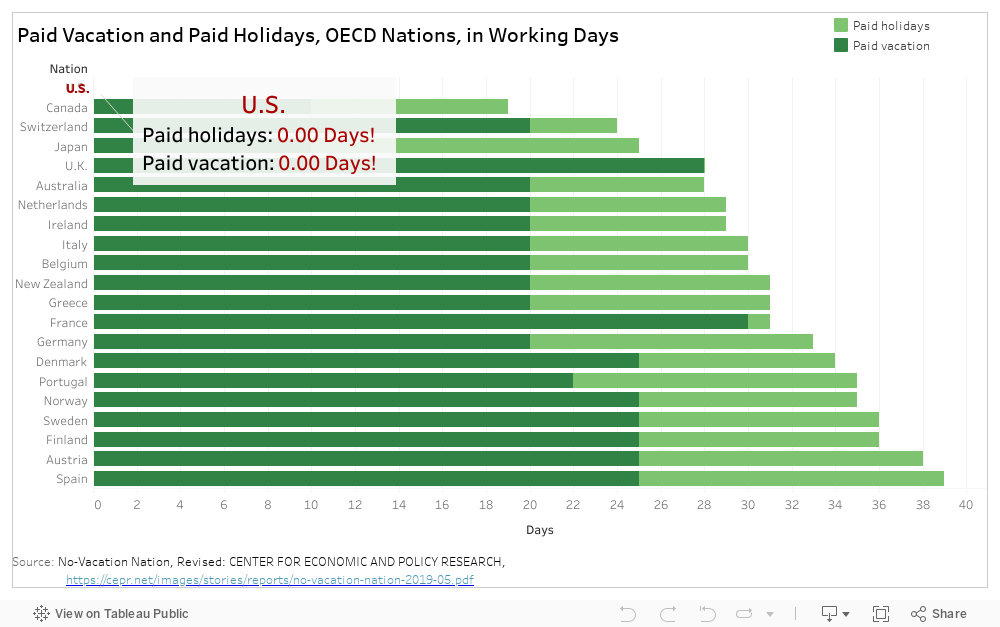
Scenario 3️⃣ No vacation? Don’t dare to take a vacation?
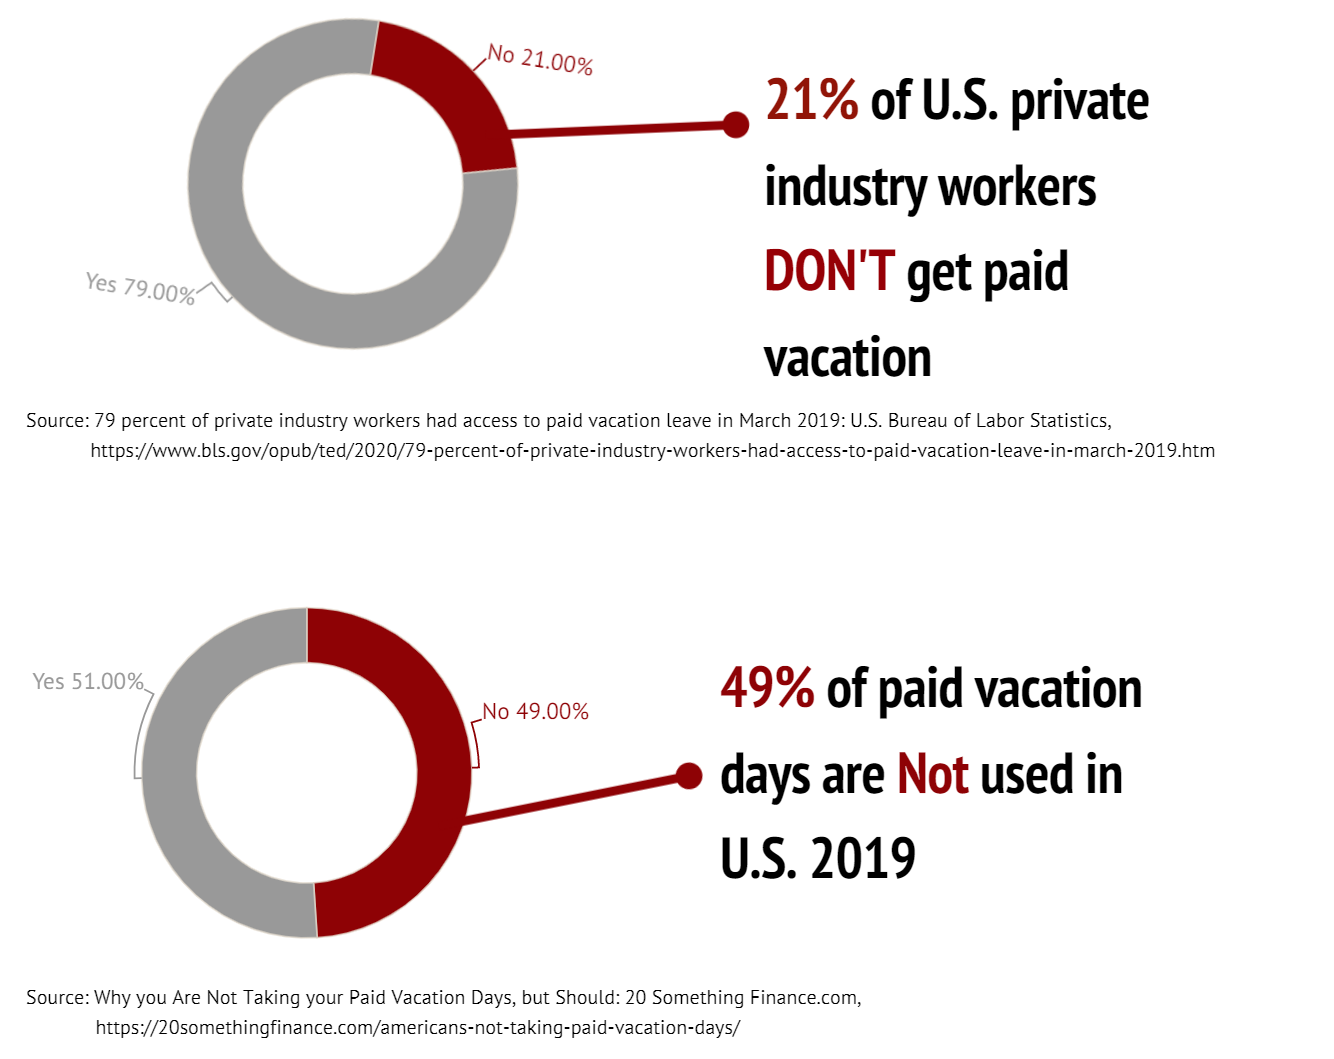
In this scenario, we will pay attention to the US paid time off situation and holiday usage data.
If we compare the paid Vacation and paid Holidays of each OECD nations4, we would find the zero day in the U.S.
✨Feedback from Classmates:
| Use red to make the U.S. more vibrant |
From the data from U.S. Bureau of Labor Statistics5 and the news from 20 Something Finance6, we would find still some workers cannot have access to paid vacation or don’t use it.
✨Feedback from Classmates:
| Delete the lines in the chart between sector chart and number, because they have the same color. |
Scenario 4️⃣ Working overtime? What about the negatives?
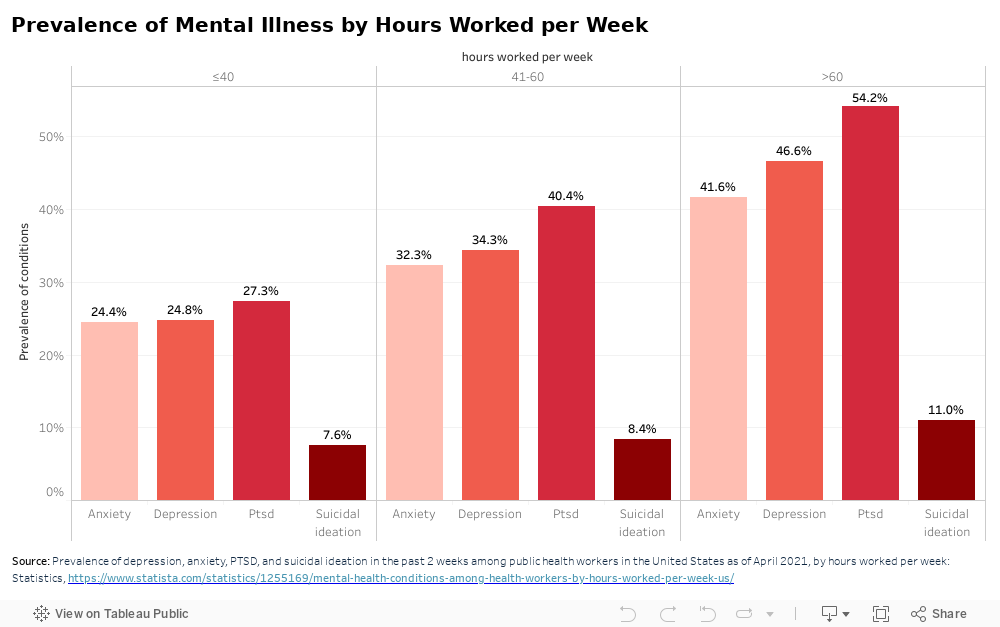
In this scenario, we will concern about the hazards of overtime work.
Prevalence of depression, anxiety, PTSD, and suicidal ideation among public health workers in the United States as of April 2021, by hours worked per week will give us more idea7.
Scenario 5️⃣ With so many hazards, why do we still work overtime?
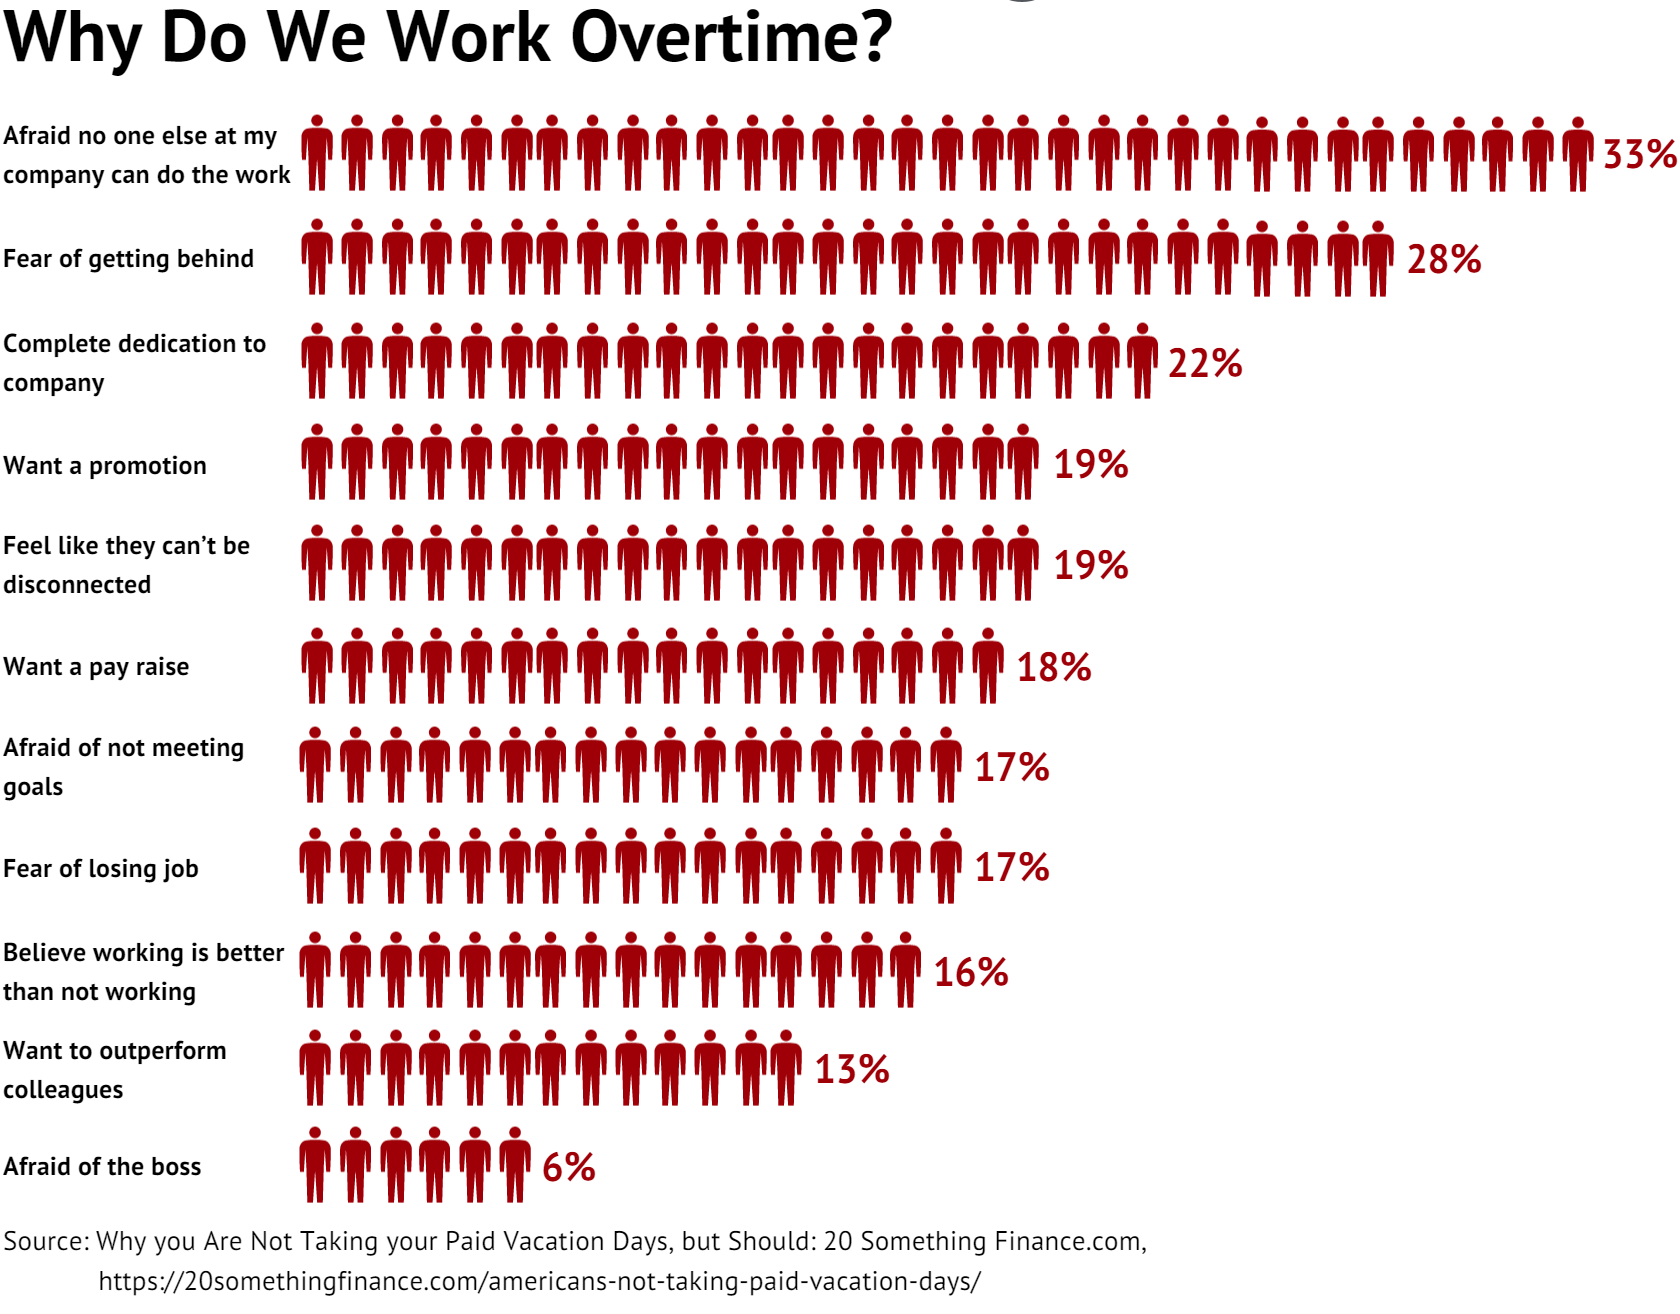
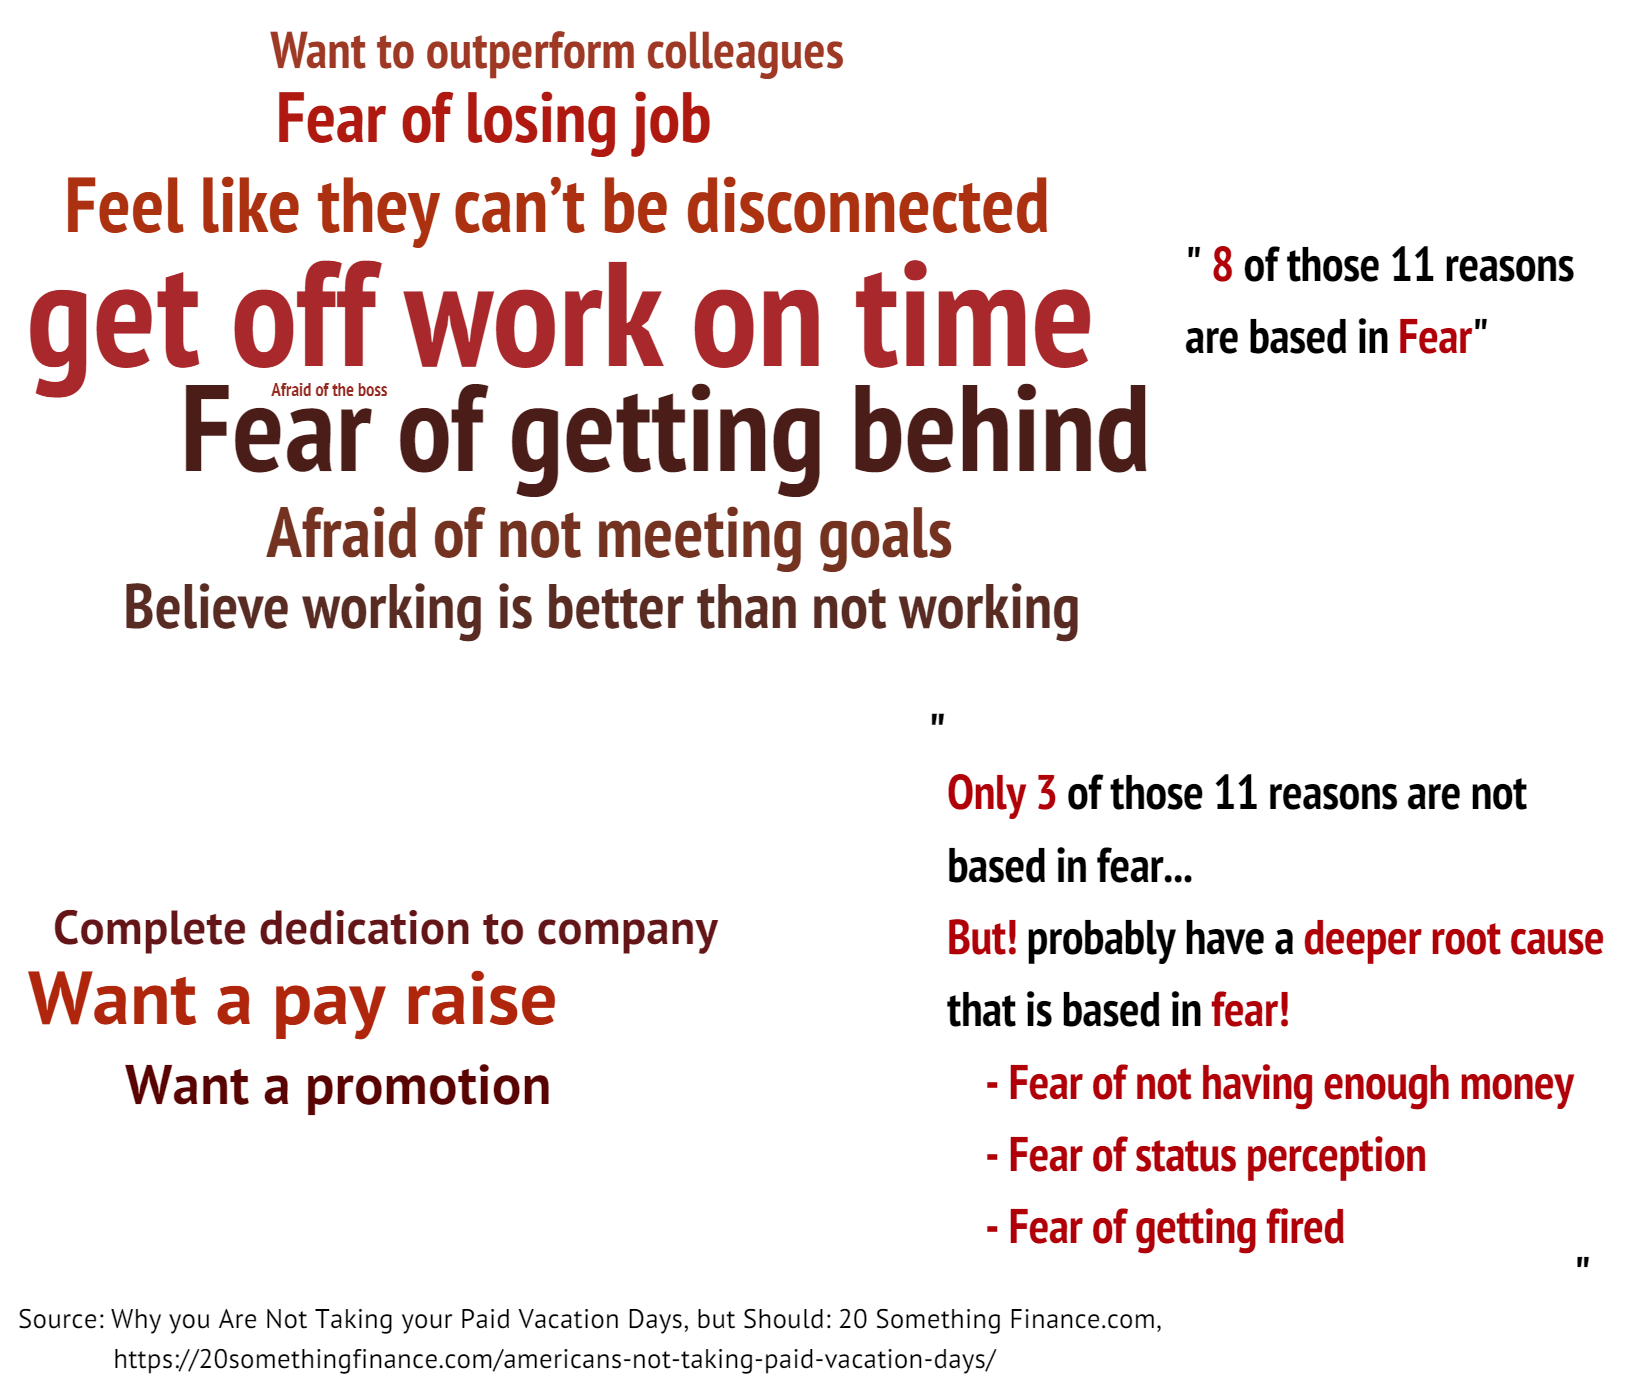
In this scenario, we will explore why employees work overtime even though there are so many hazards.
the survey from the news of 20 Something Finance will give us the answer. 8 of those 11 reasons are based in fear. And only 3 of those 11 reasons are not based in fear. But, they probably have a deeper root cause that is based in fear!8
Scenario 6️⃣ How to get more paid vacation?
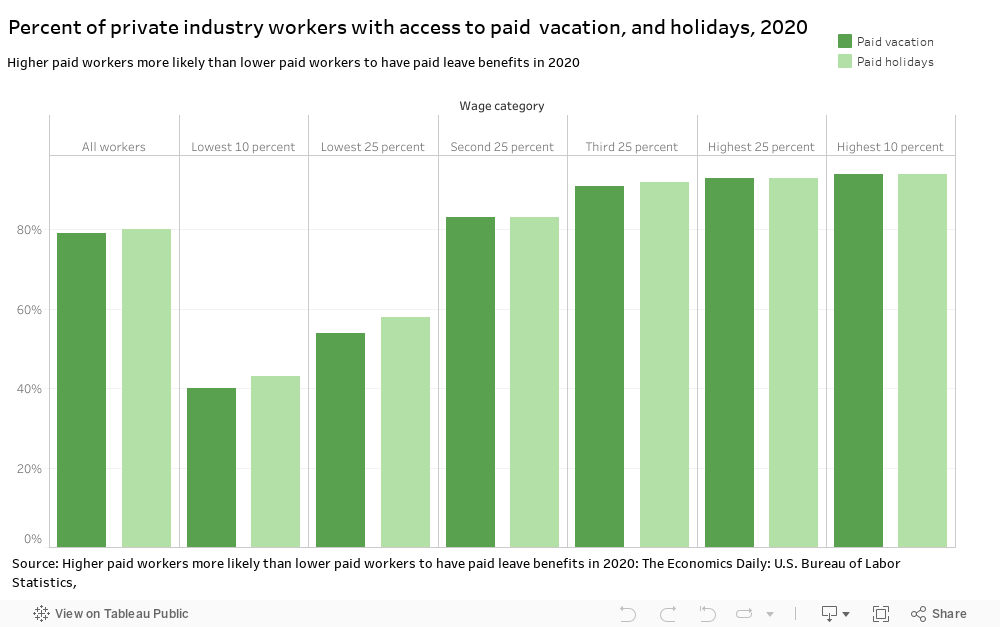
In this scenario, we will study what kind of people are more courageous to refuse to work overtime and have paid vacation.
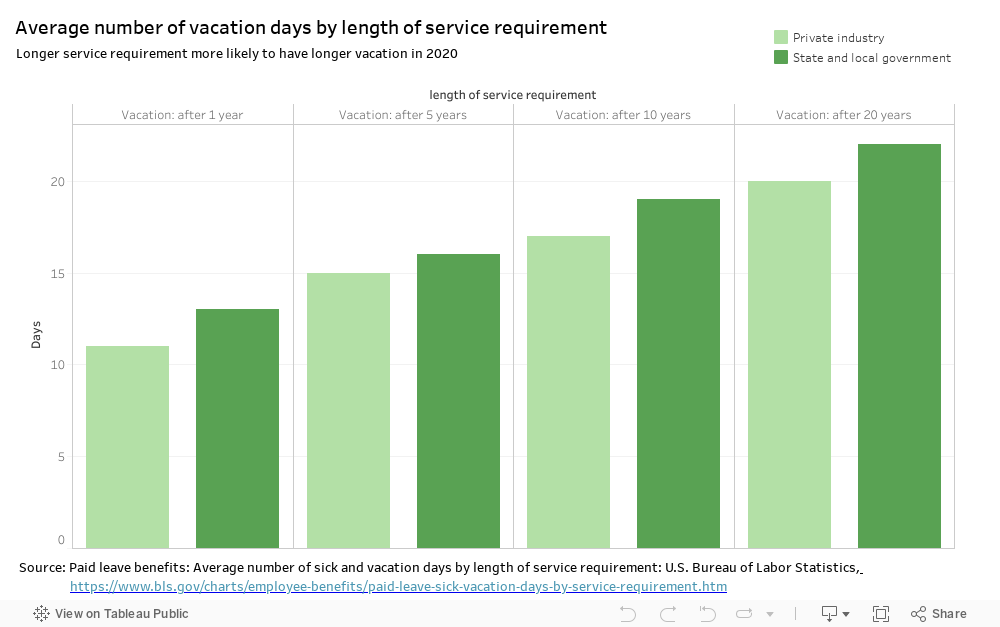
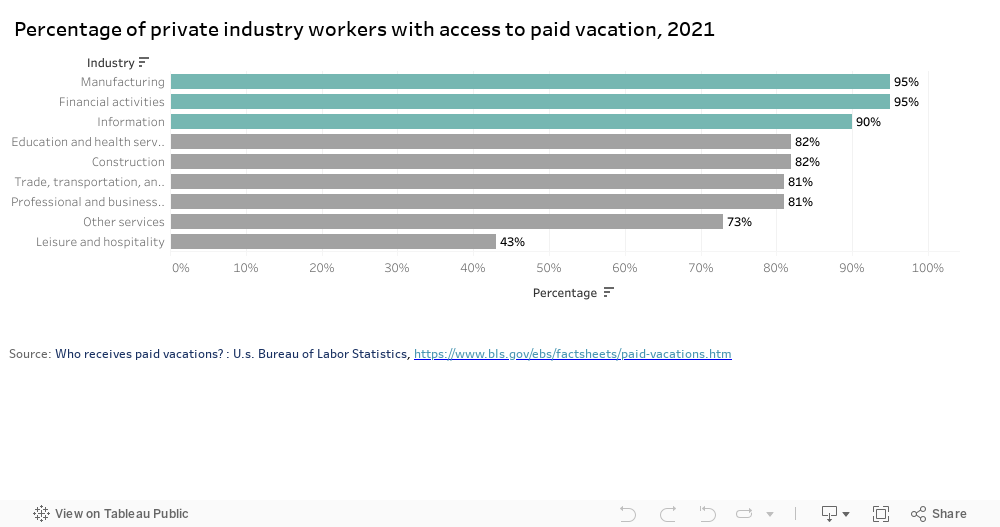
From the data of U.S. Bureau of Labor Statistics, we could find that higher paid workers are more likely than lower paid workers to have paid leave benefits9. And longer service requirement more likely to have longer vacation10. As for industry, manufacturing, finance and information industries are more likely to have paid leave benefits11.
✨Feedback from Classmates:
| Divide the chart to two divisions. One is for the all workers and the other one is for each wage. Also can change the type of the chart. And can devide the worker into the lowest 10%, the lowest 10% to 25% and so on. |
✨Feedback from Classmates:
| Also can change the type of the chart. |
✨Feedback from Classmates:
| Change the title to like "The industries CMU students will enter after graduation are more likely to access to paid vacation" to attract the viewers in the presentation. |
Scenario 7️⃣ Stand up to refuse overtime work
In this Scenario, we will call to reject meaningless working overtime.
Data Source 📊
The sources of the data have been labeled below the individual sketches. Here again, the data sources are summarized.
| Data Resource and URL | Description and Usage |
|---|---|
| Statistics on working time: The ILO Department of Statistics | The chart is used to describe average hours and prevalence of excessive working time, especially the average hours per week per employed person of each countries |
| Work and Workplace: Gallup Historical Trends | The data from survy about the working hours in the U.S. |
| Average hours per day spent in selected activities on days worked by employment status and sex: U.S. Bureau of Labor Statistics | The data from U.S. Bureau of Labor Statistics is used to describe average hours per day spent in selected activities on days worked by employment status and sex |
| No-Vacation Nation, Revised: CENTER FOR ECONOMIC AND POLICY RESEARCH | The data is used to describe paid vacation and paid holidays, OECD Nations, in working days |
| 79 percent of private industry workers had access to paid vacation leave in March 2019: U.S. Bureau of Labor Statistics | The data is to describe the percent of private industry workers with paid vacation leave |
| Why you Are Not Taking your Paid Vacation Days, but Should: 20 Something Finance.com | The survey data shows only 51% of paid vacation days being used and provide the reasons for working overtime in the U.S. |
| Prevalence of depression, anxiety, PTSD, and suicidal ideation in the past 2 weeks among public health workers in the United States as of April 2021, by hours worked per week: Statistics | The data used to describe the mental illness of working overtime |
| Higher paid workers more likely than lower paid workers to have paid leave benefits in 2020: The Economics Daily: U.S. Bureau of Labor Statistics | The data shows the higher paid workers are more likely to have paid vacation, giving us ideas about how to gain paid vacation |
| Paid leave benefits: Average number of sick and vacation days by length of service requirement: U.S. Bureau of Labor Statistics | The data shows the longer service requirement the more paid vacation |
| Who receives paid vacations? : U.s. Bureau of Labor Statistics | The data shows which industries have more paid vacation |
Method and Medium
The chart of final project will be designed and created with Tebleau, Inforgram, Flourish and Canva.
The final deliverables will be an interactive stand-alone project created with Shorthand. Each of the scenarios depicted above will have one or two pages on the final Shorthand website. Interaction and movement between pages will be used to promote interactivity and engagement with potential audiences. Moreover, key information will be highlighted through the use of color.
🥰Thanks for your reading. If you are interested in other works from my course portfolio of Telling Stories with Data at CMU, please feel free to visit my Home Page.
-
Statistics on working time: The ILO Department of Statistics, https://ilostat.ilo.org/topics/working-time/ ↩
-
Work and Workplace: Gallup Historical Trends, https://news.gallup.com/poll/1720/work-work-place.aspx ↩
-
Average hours per day spent in selected activities on days worked by employment status and sex: U.S. Bureau of Labor Statistics, https://www.bls.gov/charts/american-time-use/activity-by-work.htm ↩
-
No-Vacation Nation, Revised: CENTER FOR ECONOMIC AND POLICY RESEARCH, https://cepr.net/images/stories/reports/no-vacation-nation-2019-05.pdf ↩
-
79 percent of private industry workers had access to paid vacation leave in March 2019: U.S. Bureau of Labor Statistics, https://www.bls.gov/opub/ted/2020/79-percent-of-private-industry-workers-had-access-to-paid-vacation-leave-in-march-2019.htm ↩
-
Why you Are Not Taking your Paid Vacation Days, but Should: 20 Something Finance.com, https://20somethingfinance.com/americans-not-taking-paid-vacation-days/ ↩
-
Prevalence of depression, anxiety, PTSD, and suicidal ideation in the past 2 weeks among public health workers in the United States as of April 2021, by hours worked per week: Statistics, https://www.statista.com/statistics/1255169/mental-health-conditions-among-health-workers-by-hours-worked-per-week-us/ ↩
-
Why you Are Not Taking your Paid Vacation Days, but Should: 20 Something Finance.com, https://20somethingfinance.com/americans-not-taking-paid-vacation-days/ ↩
-
Higher paid workers more likely than lower paid workers to have paid leave benefits in 2020: The Economics Daily: U.S. Bureau of Labor Statistics, https://www.bls.gov/opub/ted/2021/higher-paid-workers-more-likely-than-lower-paid-workers-to-have-paid-leave-benefits-in-2020.htm ↩
-
Paid leave benefits: Average number of sick and vacation days by length of service requirement: U.S. Bureau of Labor Statistics, https://www.bls.gov/charts/employee-benefits/paid-leave-sick-vacation-days-by-service-requirement.htm ↩
-
Who receives paid vacations? : U.s. Bureau of Labor Statistics, https://www.bls.gov/ebs/factsheets/paid-vacations.htm ↩